I’m back….
yeah… long time not visit this journal. Alhamdulillah, I have found a suitable company to work practices. I wish I can work well there and of course better trading too. hihihihi 😛
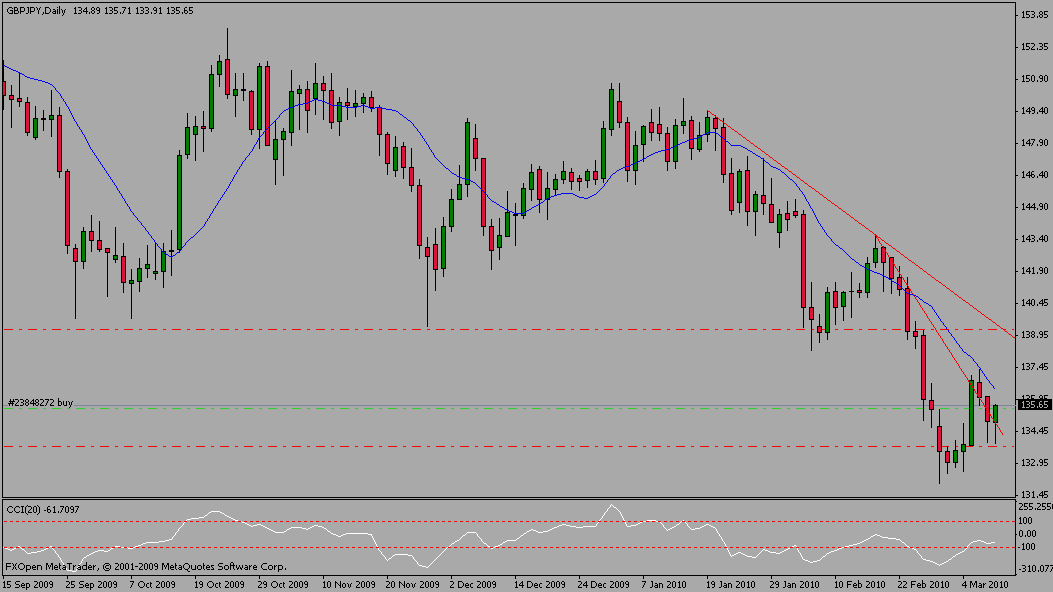
tonight I see interesting signal at GBP/JPY chart. At Daily chart, there is a Double Bottom or wanna be a Hammer / Piercing Line. And then if chart hold that position until tomorrow, it’s a good signal to entry position. Not only that candlestick pattern but also CCI Indicator gives a support where chart is at oversold position.
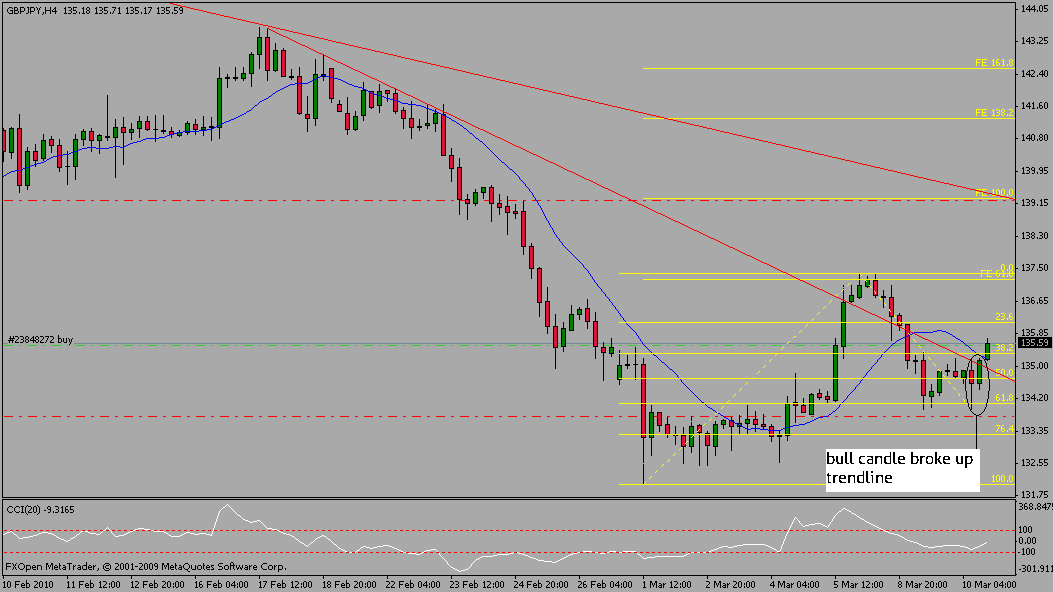
at 4 Hours chart, it became clear that chart through the trendline and SMA 14. I use Fibonacci Retracement and Expansion too. After chart touched area 61.8% Retracement, chart has consolidated. Chart through trendline successfully. I wish my analysis not wrong. The Probability rate is 87%
Cheers,
Kurosano
