Mar
28
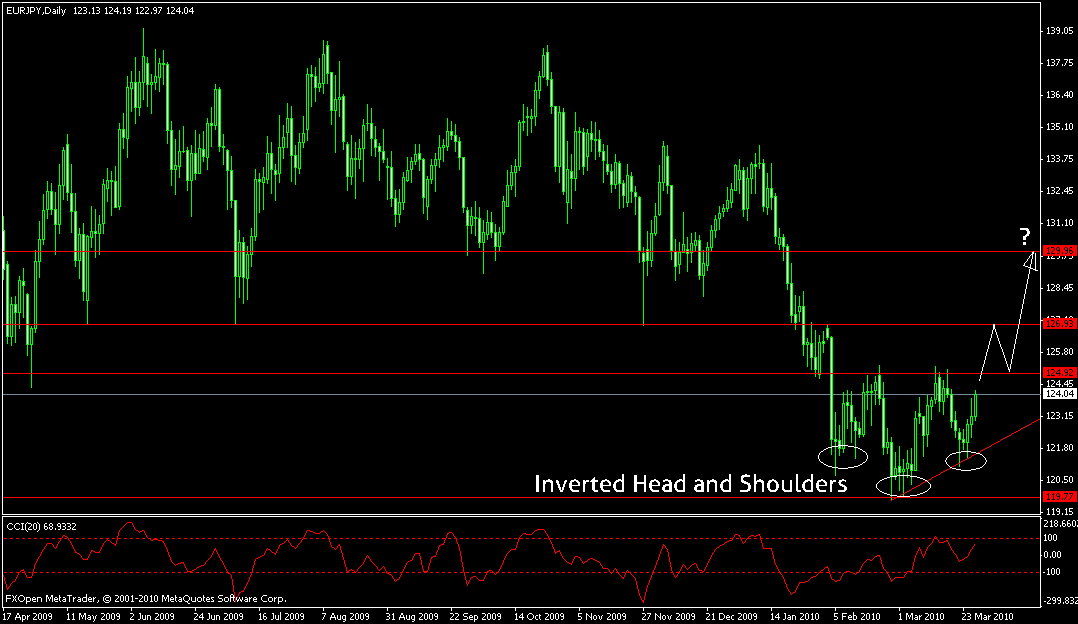
today I see an interesting chart in EUR/JPY chart. At time frame Daily, there is an Inverted Head and Shoulders pattern. It can be a good signal which charts give to me. Probability rate of Bullish is 90%. If prices really go up or bullish, maybe after price breakout from 124.92 and touch 126.93 chart will retrace to 124.92 again and then go up again until 129.96.

Cheers,
Kurosano
Category Trading Journals (English) |
1 Comment →
Mar
19
I almost forget to post my trade today.. :p
Today I’m back to focus at GBP/JPY. I found a signal to entry Sell position at this morning.
At 4 Hours chart, I draw a minor Down Trendline. So that trendline became a Resistance. When I add Moving Averages periode 14, chart looked retracement until touch MA 14. Because a minor Down Trendline meets MA 14, I guess it could be a Strong Resistance. So, I tried to entry Sell position before I go to office to work. And then CCI indicator gives support for my analysis that chart is between 100 and -100 levels. So, it could be chart would continue Bearish.
And then, this is the condition of GBP/JPY now.. ^^

I wish Target Profit can be touched by prices. 😀
Cheers,
Kurosano
Category Trading Journals (English) |
No Comments →


